Indicator Gauge Icon Legend
Legend Colors
Red is bad, green is good, blue is not statistically different/neutral.
Compared to Distribution
 the value is in the best half of communities.
 the value is in the 2nd worst quarter of communities.
 the value is in the worst quarter of communities.
Compared to Target
 meets target;
  does not meet target.
Compared to a Single Value
 lower than the comparison value;
 higher than the comparison value;
 not statistically different from comparison value.
Trend

 non-significant change over time;
 significant change over time;
  no change over time.
Compared to Prior Value
 higher than the previous measurement period;
 lower than the previous measurement period;
 no statistically different change from previous measurement period.
 Significantly better than the overall value
 Significantly worse than the overall value
 No significant difference with the overall value
 No data on significance available
11th Graders Who Reported Using Drugs or Alcohol in the Past 30 Days
Measurement Period: 2019-2021
This indicator is archived and is no longer being updated. Click to learn more
This indicator shows the percentage of 11th grade students who reported, on the CA Healthy Kids Survey, using drugs or alcohol one or more days in the past 30 days.
Why is this important?
Substance use can have immediate and long-term negative consequences for young people, and evidence shows more long-term consequences for people who start using substances early in life. CDC research shows that the majority of adults who meet the criteria for having a substance use disorder started using substances during their teen and young adult years. Data from the CA Healthy Kids survey suggest that more young people begin using substances at an earlier age in Humboldt County than in California overall.
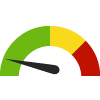
County: Humboldt
35.0%
Source:
CA Dept of Education
Measurement period: 2019-2021
Maintained by: Humboldt County - DHHS
Last update: January 2024
Measurement period: 2019-2021
Maintained by: Humboldt County - DHHS
Last update: January 2024
Filter(s) for this location: State: California
Compared to

Graph Selections

Data Source
- CA Dept of Education
Note: This source uses Zip Code Tabulation Areas (ZCTAs) for its Zip Code data. Learn more
Maintained By: Humboldt County - DHHS
Filed under: Health / Adolescent Health, Health / Alcohol & Drug Use, Health / Mental Health & Mental Disorders, Health Behaviors, Teens