Indicator Gauge Icon Legend
Legend Colors
Red is bad, green is good, blue is not statistically different/neutral.
Compared to Distribution
 the value is in the best half of communities.
 the value is in the 2nd worst quarter of communities.
 the value is in the worst quarter of communities.
Compared to Target
 meets target;
  does not meet target.
Compared to a Single Value
 lower than the comparison value;
 higher than the comparison value;
 not statistically different from comparison value.
Trend

 non-significant change over time;
 significant change over time;
  no change over time.
Compared to Prior Value
 higher than the previous measurement period;
 lower than the previous measurement period;
 no statistically different change from previous measurement period.
 Significantly better than the overall value
 Significantly worse than the overall value
 No significant difference with the overall value
 No data on significance available
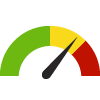
Age-Adjusted Death Rate due to Suicide
Measurement Period: 2019-2021
This indicator is archived and is no longer being updated. Click to learn more
This indicator shows the age-adjusted death rate per 100,000 population due to suicide.
Why is this important?
Suicide is a leading cause of death in the United States, presenting a significant public health challenge. More than 48,000 people lost their lives to suicide in 2021 according to the Centers for Disease Control and Prevention. Each year an estimated 25 suicide attempts occur for every death by suicide. While all people can experience suicide risk, certain groups experience unequally high rates of suicidal behaviors and death. For example, in the United States, women and youth of color attempt suicide at greater rates than other groups, while middle-aged and older white men die by suicide at greater rates. Every life lost to suicide has immediate and long-term impacts on individuals, families, and entire communities. While suicide remains a significant public health issue in our county, there is hope. The evidence for effective suicide prevention practices is growing every day. Nationally and locally, many communities that experience higher risk are taking action to address suicide in ways that are relevant to their communities and acknowledge the resilience and power of the people most impacted. If you or someone you know is in crisis, please contact the Suicide & Crisis Lifeline at 988 or 988lifeline.org.
The Healthy People 2030 national health target is to reduce the suicide rate to 12.8 deaths per 100,000 population. County: Humboldt
20.3
deaths/ 100,000 population
Source:
California Department of Public Health
Measurement period: 2019-2021
Maintained by: Conduent Healthy Communities Institute
Last update: August 2023
Measurement period: 2019-2021
Maintained by: Conduent Healthy Communities Institute
Last update: August 2023
Filter(s) for this location: State: California
Compared to

Technical note: Data compiled by CDPH using the California Comprehensive Master Death Files.
Graph Selections

Data Source
- California Department of Public Health
Maintained By: Conduent Healthy Communities Institute (Methodology)
Filed under: Health / Mental Health & Mental Disorders, Health / Mortality Data, Health Outcomes